My Pi Description

My Experiences With the Raspberry Pi -- Tracking My Learning -- My Pi Projects
Showing posts with label 2 line x 16 character LCD Display. Show all posts

Tuesday, November 12, 2013

Adding Graphical Users Interface to Graphing Temperature Measurements

I started a series of blog posts back in July about making temperature measurements with sensors using the one-wire interface to the Pi. I described the hardware, software requirements, and the python script I wrote to make and report the measurements.
Earlier this month, I added graphing capability using RRDtool and PyRRD. The python script is, of course, included. Prior to that post, I presented a tutorial on programming with RRDtool and PyRRD. The graphical results are pretty impressive. My only complaint concerns actually running the script. Before making any measurements, the user has to answer quite a few questions that appear on the terminal. Answering all of those questions, each time I run the script, got a bit tedious, so I thought about adding a graphical users interface, i.e. popping a window for those questions and answers. This post reports on those efforts.
Before proceeding any further, I hope you readers have taken a look at my post proceeding this one (Oct. 18). While developing and testing my GUI I ran into a serious problem. The script must be run from root because of access to the the GPIO hardware on the Pi. I found that Linux would not give me permission to access the graphical system running as root. Look at that post to see how that problem was handled.
When you launch the script here is the default window that pops up. I'll talk about why I mentioned default window in a little bit:
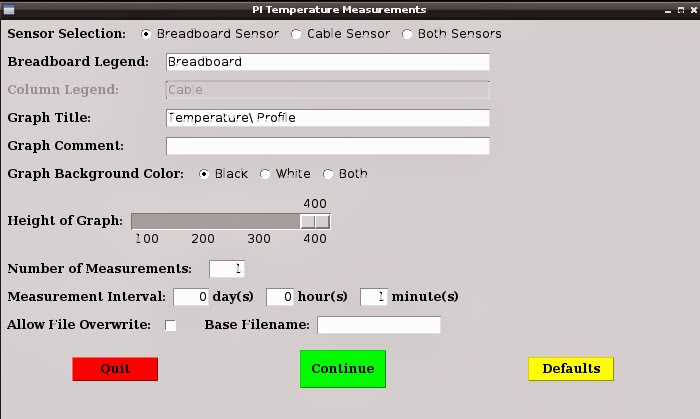
Taking this from the top of the window, I'll discuss each of the widgets, in turn: I have two temperature sensors, one on the breadboard the other on the end of a cable. With the radio buttons I can choose either sensor, or choose both sensors. You might think two check boxes would be more appropriate than the three radio buttons. But, the radio buttons work better with the program that actually makes the measurements (the program that calls for the GUI window).
Next are two entry boxes for applying a legend to the graph for each sensor. The default has only the breadboard sensor enabled because of the radio buttons selection above, which is why the cable entry box is grayed out. Select cable sensor and the entry box for cable can be edited and the breadboard entry box is grayed out. Select both sensors and neither entry box is grayed out. If you don't type anything in the entry boxes the default text (as shown) will appear on the graph. RRDtool has its own rules and some may seem strange. Here, for example, if you wish to have a colon in your legend (cable: water temperature), you must escape the colon with the backslash character (cable\: water temperature).
After the legend comes the title for the graph. A default string is included. RRDtool does not require you to escape colons in the title, but does require you to escape spaces.
Comments are optional. You must escape colons here too, just like the legends.
Next we can choose the graph background color. Black, I think, looks good on the screen, but if you wish to send the graph to your printer, it would use an awful lot of ink. Consequently, we have an option of having a graph with a white (actually light gray) background, You can choose to create both graphs if you wish. In the future, I would like add the possibility of a custom color graph. That would have new windows popping up from the basic window, something I want to try coding. Like the situation with the sensor widgets, check boxes might seem to be more efficient, bur radio buttons work better with the script making the measurements.
The width of the graph is hard-coded to 600 pixels, but the height is programmable with the slider control. You can choose values from 100 to 400 pixels in increments of 100. A shorter graph is useful when the variation in the measurement values is small (nearly a straight, horizontal line). I have seen where RRDtool actually repeats values on the Y axis if the graph height is large and there is a small variation in measurement values. RRDtool selects the values on the Y axis, not the programmer.
Next, we have the number of measurements and the interval between measurements. The smallest interval being one minute.
Finally, we come to the matter of file names. As of now (meaning I may alter this in the future), the directory name is hard-coded in the script. I have a directory for all temperature measurements, but make up a new sub-directory, under that, based on the date (for example: 2013_10_25 for Oct. 25, 2013). The file name asked for by the widget is a base name without extension. Depending on the number of sensors used, and the number of graphs generated, we will make three to five files for each run of the script. The measurements used for the graph are stored in files with an .rrd extension - one file for each sensor. There is a .png file for each graph (one for black background, one for white). Finally, there is a .txt file generated to store all of the results, along with the measurement times, in an easily read form (the .rrd files are not easily read). This .txt file is another feature that is new with this version. If, for example, the base file name is rodger and we were to use both sensors, and generate both graphs, we would generate the following five files: rodger.txt, rodger_bread.rrd, rodger_cable.rrd, rodger_black.prn, and rodger_white.prn.
The check box to the left of the file name is to protect the files from being overwritten if they already exist. It looks in the directory with the current date. Putting a check mark in the box allows the files to be overwritten.
Let's put some values into the entry boxes but we'll make errors in all of the boxes:
After pressing the "Continue" button, the red error messages show up to the right of the entry boxes. The legend and comment boxes have non-escaped colons and the title has a non-escaped space. The measurement interval can not be zero (the number of measurements will give the same error if they total to zero). The error message will appear if a non-numeric character appears in the number of measurements or any of the measurement interval boxes.
There are three possible error messages that can appear to the right of "Base Filename". They are:
  • Only numbers, letters, and underscore
  • Will overwrite existing file ("Allow File Overwrite" not checked
  • Must enter a file name (if you leave the box empty)
Once all of the corrections have been made, hitting the "Continue" button will kill the window and allow the program that makes and graph temperature measurements to proceed. If you hit the "Quit" button the window closes and the calling script terminates.
One other action happens before the window closes. All of the parameters entered in the window widgets are saved into a configuration file. The next time the program is run, all of the parameters are loaded into the window rather than the default values. This should save a lot of time if the same run is repeated or only a few changes are made. If a lot of changes are to be made a press of the "Default" button will bring up all of the default values.
Let's do an actual run. The cable sensor is placed into a 12oz. glass of hot tap water and allowed to cool to ambient temperature. Here is the window:
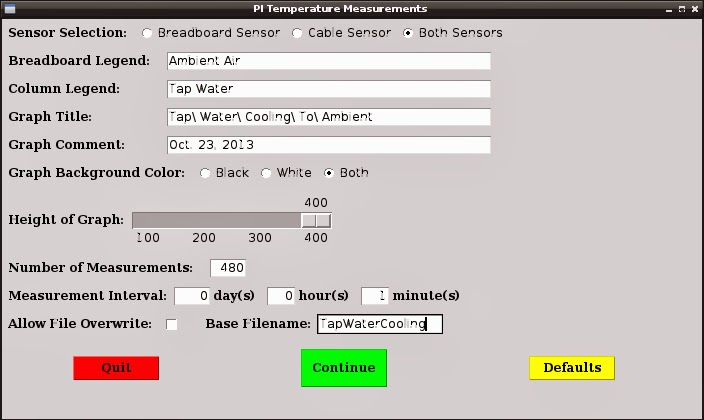
After pressing the "Continue" button the window closes and you see the terminal window:
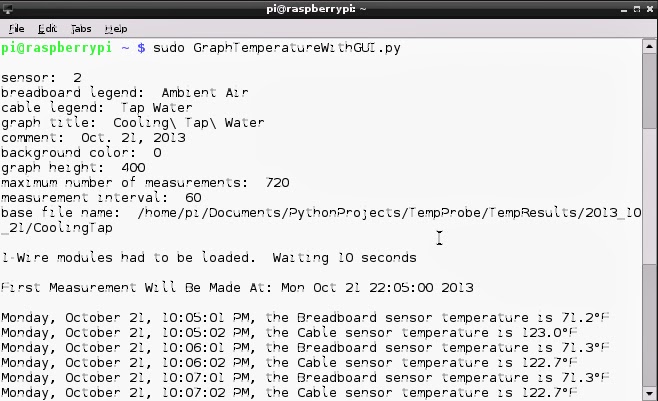
The terminal window shows the parameters chosen on the GUI. It gives you a last look at your selections. If you decide you wanted something else, simply hit Ctrl C to terminate the script. A careful reader will notice the parameters on the terminal screen do not match the parameters chosen in the window above. That is because I forgot to save the screen shot, so two different runs are represented.
Below the parameters it says that the 1-wire modules had to be loaded. They are not loaded upon boot-up, so every time the Pi is powered up, or rebooted, the 1-wire modules must be loaded. The script checks to see if the modules are loaded, and, if not, loads them. Subsequent runs of the script will not need to load the modules if power stays applied and the Pi is not rebooted. Next, the script displays when the first measurements will be made. Recall that measurements are synchronized with the measurement interval. Since one minute was selected, we wait for the seconds to be 00. Next, we see the display of several measurements showing the day of the week, date and time, sensor, and the temperature as measured. The measurement results, along with time and sensor, are also displayed on my 16 character by two line Led Display.
After all of the measurements have been made, as stipulated by the value in "Number Of Measurements", the script will stop. If you wish to stop the script prematurely, you can simply issue a Ctrl C or press the switch on the breadboard.
Once the script is terminated, the terminal display looks similar to the figure above. This information is from yet another run. I did not coordinate that aspect of this post very well. You see the last of the measurements followed by a salutation and the reporting of the fact that there were no glitches.
Originally, I had problems with measurement failures where the device file could not be read. I call that a glitch and keep track of the number of glitches for the entire run. My solution to recover from these glitches is to unload and reload the 1-wire modules. For every glitch, I only unload and reload the modules a maximum of three times. If there is no recovery after the tree tries, I stop the script and report a message. This problem has not reoccurred, I have not seen any glitches for a long time.
The start time and stop time, are followed by long numbers. These numbers are the number of seconds since January 1, 1970. This is how RDTool records numbers in the .rrd files. If you want the time on the graph to be correct, you must apply these long numbers to the measurements. I report those numbers at the end here in case you wish to investigate the .rrd files. The information in the .rrd files look like gibberish if viewed with a text editor. You have to issue a RRDtool command to see the contents of these files. For more information see my post "RRDtool For Dummies Like Me" under the topic "What Measurement Values Go Into the Database".
Let's look at the code. The code is divided into two scripts, one for the GUI and the other for the main program that makes, graphs, and records the temperature measurements. The reason for a separate script for the GUI was to minimize changes to the main script. The main script is derived from the code shown in my blog entry, "Graphing Real Temperature Data Using RRDtool and PyRRD". The code for the GUI was developed independently, and has test code at the bottom so it can be run by itself, to check its operation. The GUI script was made a callable module by saving it as a .pyc file. The first 425 lines of the GUI code becomes a single function, guiwindow(). All of the parameters collected in the window are passed to the main script by line 103 of the main script:
     variable_list = guiwindow()

Code For the GUI Window:

I know it's a rather long script (another reason for making it separate from the main script), but a lot goes on here. Each element of the window (widgets) must be defined. Some of the widgets, when clicked on by the user, spurn actions. These actions must be defined. A lot of code is devoted to making the appearance correct. Placement of widgets is somewhat of a challenge. As in most GUI applications, user inputs are checked to make sure required parameters are not missed, or errors made. The operator is made aware of these errors by messages so he knows what to correct. The error checking requires a lot of code. Just look at the function proceed(). Most of the widgets have error messages included in their definations.
The development of the GUI is done using a module called Tkinter. It is probably available for all, common, Linux distributions for the Pi. I have developed all of my code using Python 2.7 so my line to import Tkinter is: "from Tkinter import *". In Python 3.x, that line would be "from tkinter import *". Tkinter is not just for Python, and not just for Linux.
So, how does one get started developing GUIs for their Raspberry Pi projects? There are many references, including "The Python Library Reference". This document points you to other sources, including the Python Wiki, a source with even more sources. One source you need to have available, constantly, is "Tkinter 8.5 Reference: a GUI for Python" from the Computer Center of New Mexico Tech. You need this for no other reason then getting the syntax correct. It is really a great asset to GUI development. Another good source of help is my code above, and code of others, for you to see practical examples. There are even YouTube videos with Tkinter tutorials. There is a ton of stuff out there on the net on Tkinter.
There are a few other items of interest in this script. Note the use of the Subprocess module in the function "getdirectory()". This is a way of issuing the Linux Ls command from Python. Here, Ls is used to see if a directory has been previously made. If it does not exist, the function makes the directory. Another cool thing is what happens, after the user presses "Continue" and the inputs have been found to contain no errors. Before the window closes and operation passed to the main program, all of the user's input gets saved to a file. When the window is opened again, the information in this file populates the widgets. This is done using a module called Pickle (actually cPickle. A version developed using C that runs faster than Pickle). Check it out, Pickle is a very efficient way to do the job and saves you from writing many lines of code.

Main Script For Making, Graphing, and Recording Temperature Measurements:

Since this code for the main script was discussed in my earlier post, I'm not going to say much about it. One element I added is saving the results to a text file. I discussed this earlier in the post. Lines 281 - 288, 312 - 319, and 327 - 334 handle this task. The directory and file name come from the GUI window.
I almost forgot, here are the two graphs:

Wednesday, October 2, 2013

Graphing Real Temperature Data Using RRDtool and PyRRD

My previous blog post, "RRDtool for Dummies Like Me" was a tutorial on the use of RRDtool and PyRRD to graph data from a python script. For simplicity, I used made-up data. This post talks about plotting real data taken with the Raspberry Pi.
In June and July of this year, I wrote five blog posts about measuring temperature with the Dallas Semiconductor DS18B20 One-wire temperature sensor. The temperature measurements were reported to the terminal screen and my 16x2 LCD display (seen in photo in blog header) so would not be saved. I did modify the script to send the results to a file but have not reported on that effort. Perhaps that would make a worthwhile post for later.
It just seemed natural to want to plot that data to see the change of temperature with time. That led to my investigation of RRDtool and PyRRD, and to the tutorial in my last post. This post combines temperature measurements with plotting in a python script.
I have two DS18uB20 temperature probes in my system. One looks like a small transistor and sits on the breadboard and the other is at the end of a cable. For the graph below, I put the cable sensor in a glass of hot tap water while the breadboard sensor measured ambient air temperature.
The python code follows.
The script is an evolution of code I reported on previously. All the One-wire temperature code was discussed in my June and July posts. The plotting code grew out of the code in the last post. The code for the LCD display came from my posts of March and April of this year.
My python script may seem pretty large, but I wanted to make it useful, and to incorporate all of the hardware connected to the Pi that makes sense to use. These are some of the features:
  1. Choose to use either sensor, breadboard or cable, or both sensors.
  2. Choose graph characteristics:
    1. If desired, give the breadboard, and/or cable sensor another name.
    2. Give the graph a title - mandatory
    3. If desired, enter a comment that prints on the graph.
    4. Select graph with either black or white background, or choose to make both graphs. White background is best to print. It's easier on printer ink. I think black looks better on the screen, like as seen in the sample graph.
    5. Enter the height from 100 to 400 pixels. If you are plotting from one sensor of a temperature that does not change much it is better to choose a lower value for the height. Otherwise, RRDtool may repeat the values on the Y axis, like: 70, 70, 70, 71, 71, 71, 72, 72, 72, etc.
    6. Choose a file name. Up to four files will be created with that name: an .rrd file for each sensor chosen, and a .png file for each background color chosen.
  3. Choose the maximum number of measurements to make for each sensor. The script will stop once that number of measurements (for each sensor) is reached. In the future, I may modify the script so that once the maximum is reached, new measurements replace the oldest measurements. Remember, this is how a round robin database works.
  4. Choose the time interval between measurements, in minutes. For each sensor: The first measurement will be taken at the first time corresponding to the time interval. For example, if the time is now 37 minutes past the hour, and 15 minutes is selected as the time interval, the first measurement will be at 45 minutes past the hour. If you select the time interval to be one day, the first measurement will be made at midnight. When making the plot, RRDtool will only place a measurement point at a time corresponding to the nearest measurement interval. Again, as an illustration, if we choose a day as the time interval, and we made a measurement at 8PM, the plot will show the measurement at midnight, and --- unless it is the first measurement, the value will be different. That value is not even the linear interpolation of the measured value. See my past post. Strange, but that is the way the tools work.
  5. After entering all of the user information, you have a chance to review and enter the information again, if you are not satisfied.
  6. You can choose not to proceed after entering the user information. This will stop the script.
  7. As well as plotting the temperature data, the average temperature for for each sensor, is calculated and displayed below the plot.
  8. The current measured temperature value, for each sensor, is displayed on the 16 character by 2 line LCD display.
  9. All measurements are sent to the terminal along with the time of the measurement.
  10. There are three ways to stop the script:
    1. When we have reached the maximum number of measurements.
    2. Pressing CTRL-C from the keyboard (Issuing a keyboard interrupt).
    3. Hitting the switch on the breadboard.
There were two things that did not work out as I wished. The first is that RRDtool/PyRRD makes adding some text to the graph somewhat difficult. The title requires you to escape all spaces and probably some punctuation. A space needs to be "\ " in the variable (title_it). It's so easy to forget to add that backslash that I tried to have the script do that for you. It would seem that the following would work:
      title_it = title_it.replace(" ", "\ ")
It doesn't. It replaces a space with "\\ ". This is a title prints on the graph: This\ is\ a\ title, which looks pretty dumb. The following does not work either, giving the same result:
      title_it = title_it.replace(" ", r"\ ")
Since I had no luck adding the backslashes before the spaces, I have the script, in the function check_title, check that the user added the backslashes. Note that the user type "\ " for each space, but the function looks for "\\" before each space (line 103). That makes sense, the first backslash escapes the second backslash.
Here's the second thing that did now work out: I wanted to handle all of that user input with dialog boxes. Using stdio is a bit clunky and if you decide to change some input, you have to enter everything again. Besides, I wanted to learn to incorporate those features. Python has a nice module called Tkinter which brings the graphic users interface to python and other programming languages.
I experimented with a simple program to bring up a dialog box to enter or choose a file name. It worked just fine. I could run it from a Idle Python shell, or from the stdio. No problem. Then I incorporated some GPIO code which meant I had to run the script as root. Now it failed. It threw an exception saying, "Client is not authorized to connect to the Server .....". By client, I assume it means root. Obviously, if the user is me, it works fine, but not if the user is root.

Tuesday, June 25, 2013

A Raspberry Pi Thermometer - My Software To Display Temperature

Let's back up for a moment. Two posts ago, I indicated that the Raspbian and Occidentals distributions have support for the 1-Wire interface and the DS18B20 temperature probes. We see this implemented in the kernel modules w1-gpio and w1-therm. I said that the only support I knew of was to read the temperature, and that you could not write to the device to change the resolution or set temperature limits. There is one other limitation I forgot to mention: You can only use GPIO 4 to interface the device to the Pi - no other choice is possible.
I wrote a python script using my two temperature sensors. It takes repeated measurements but is not greatly practical as it does not store the measurements. I'm going to add that capability next. I guess I'll start by writing the results to a file. I'm going to investigate RRDTool which is a way to put the results into a database. The program includes graphing capabilities, which sounds fascinating.
I kind of overloaded my script with a lot of stuff, because, after all, I'm doing this to learn. I don't really have a pressing need to make temperature measurements. I do this for fun. Luckily, I don't have to program to please a client, or employer, or to comply with any deadline. The Pi, along with python programming, is just an adult toy.
Functionally, the script asks the user how frequently to make measurements and which of the two probes to use. The program outputs each measurement to the terminal screen along with the date and time and the sensor choice. It also outputs the temperature, along with the date and time, to my 16 character by 2 line LCD display. The user terminates the script by issuing a keyboard interrupt (CTRL-C) or by pressing the button on the breadboard. The script then tells you when you started the run and the duration of the run. Here is a sample from a very short run:
Screen Shot of Terminal Output After a Short Run of the Script
Readout on the LCD Display
Without further ado, here is the script:
I would like to talk about what I find interesting about the script. I'll take it from the top and work down.
Lines 17 - 23: We need to import quite a few modules. I'll come back and talk about the commented out module in line 19 later. Line 23 is the module I wrote that has the functions to control the 16X2 LCD display. You can see this code on my blog entry "16 X 2 LCD Base Code" of March 23, 2013.
Lines 25 - 36: Here's a bit of extravagance. The only lines here that are necessary are lines 34 and 35. All the other lines in the function are superfluous. This function looks to see if the two modules w1-gpio and w1-therm are loaded in the kernel. If not, it loads them. When you load the modules, run the script. and then terminate the script, the modules stay loaded in the kernel. If you run the script again, it's OK if the script says to load them, if they are already loaded. My checking to see if they are loaded is unnecessary. But, I'm not doing this for a living, so a few extra lines is no big deal.
When I saw lines 34 and 35 in every other python program dealing with the DS18B20, I was very curious about that Linux command "modprobe". What did it do? I found this site.It has everything I needed to know: how to load modules, remove modules, and see what modules are present in the kernel. I wanted to use this information in my script, thus all those extra lines.
The loadmodules function demonstrates two methods to run a Linux command in Python. One uses the Popen method in the subprocess module (line 29), and the other uses the system method in the os module (lines 34 and 35). The second method is useful for commands that do not return anything you are interested in knowing about. It would be the one to use if you wanted to run "cd" to change directory. If you wanted to list the contents of the directory using "ls", the Popen would be the one to use. To see if the w1-gpio and wi-therm modules are loaded we issue the "lsmod" command, which lists the loaded modules like "ls" does for directories and files. The output is redirected to the stdio using the "stdio = subprocess.PIPE" optional argument. In the same way, we redirect any error to the stdio.
There appears to be an error in either line 31 or lines 34/35. But they are correct. If the two modules are loaded, the output of "lsmod" shows the module names with the underscore. When we load the modules, we use the dash in the names. Strange.
Lines 38 - 67: This function is rather long because it captures the occurrences of the w1-slave file failing to open. I talked about this in previous posts. If that glitch never occured, only six lines would be necessary (38, 47, 48, 63, 64, and 65). We use the Popen method to read the two line w1-slave file in line 47 (see the last post to see examples of these two lines). The output is redirected to the stdio and we read the contents in line 48. We do not have to bother to close the file. Lines 47 and 48 are a good alternative to using the open command, followed by the read command, and the close command. Note in line 48, we also read any error, such as ".....file not found" and can easily deal with the error. Using the open command, if the file is not found, then an exception is thrown and we have to handle that exception. Not a big deal, but the Popen approach seems much more efficient.
If an error occurs, my approach to recover is to unload the modules using the modprobe -r command and then reload them after a short delay. I wait 10 seconds at the end to give plenty of time for the modules to load. I tried to recover from the error by simply rereading the file (reissuing the Popen command), but that did not work. Once the error occurred, it kept occurring until the script was terminated. Unloading and reloading the modules does seem to work. I only do the unload and reload module process three times. If there is still an error, the script stops, by the statement raise(IOError). We'll talk about this statement when we discuss the main program. For my own information, I keep track of the occurrences of w1-slave failing to open in the variable glitches.
Lines 69 - 83: The print2display function simply takes the current time and the temperature and outputs the former to line 1 and the latter to line two of the LCD display. I found that those 10ms. delays were required to keep the display from going berserk after a time.
One of the fun aspects of this project was playing with the methods in the datetime module. The current time is determined by the now method in the datetime.datetime module and passed to the print2display function. The strftime method is a way to format the time in a variety of ways. Look here at section 8.17. in the Python documentation.
Lines 85 - 104: This is another example of throwing something in for the fun of it. Before the program terminates I wanted to print the duration of the run. Why do this? Simply because I wanted to figure out how to do it. I had read about the method timedelta in the datetime module in the Python documentation but could not understand it. That was because I thought timedelta took two date/times and reported the difference - just what I wanted. I was wrong, timedelta applies a time difference to a date/time, and reports a new date/time. I did make use of timedelta in the commented out line 92. More on this later.
At the beginning of the main part of the program I save the current time in the variable starttime. To use starttime in my function, I declared it a global variable. I could have easily passed the value of starttime to the function totaltime. I have a feeling that would have been the preferred method. To find the elapsed time, I simply subtract the starttime from the time at the end of the run and make a string of the result.
Now is a good time to discuss the commented out line 92 and the commented out line 19. I left those lines in the script for the purpose of discussing testing. You should test as much of your scripts as possible to assure they will work under various circumstances, and, for this script, will work with long duration runs. The string in line 97, the value of elapsedtime can look very different if the run time is over or under a day. Let's say the run time was 23 hours, 59 minutes, and 59.99 seconds. The string value of elapsedtime will be '23:59:59.990000'. If the run duration is one minute longer, elapsedtime looks like this: '1 day, 0:00:59.990000'. Quite a bit different. For testing this, I didn't want to make a run of over one day, so that's is where I used line 92. Using timedelta, I just added 24 hours to elapsedtime to get the string with the 1 day in it. Worked like a charm. You can see how I parsed the string value of elapsedtime to print the time in days, if needed, then hours, minutes, and seconds.
Lines 106 - 116: There is a momentary switch on the breadboard (that square job with the number 4 printed on it). It's purpose, here, is to provide a second way to exit the script. Checking the switch position is a matter of looking at the GPIO pin connected to the switch. If it is a logic high, the switch is not pressed (pin is pulled up by a resistor to 3.3V). Pressing the switch grounds the pin. If the function sees the pin low, it waits 200ms. and looks again. If the pin is still a logic low, it assumes the switch is really being pressed. The final action is the statement raise(KeyboardInterrupt). I'll reserve comment about this until later.
The Main Program:
Lines 131 - 137: One of the elements I really wanted to incorporate into my script was error handling, and error creating. These seven lines are a small manifestation of error handling which is implemented with the try and except statements. When a script encounters an error that is not "handled" within the script, it just stops and you receive an error message. The try and except statements are what you use to "handle" error messages. If an error occurs while processing the try block (the indented code below the try: statement), execution moves from the try block to the except block. Once the code in the except block is executed, execution moves to the code beyond the except block. For example, when asked to input a value to measurement_interval you input a letter rather than a number. Without the error handling, python will stop the script because measurement_interval expects a float, not a string literal. Python throws an exception, and prints: "ValueError: could not convert string to float" Since we don't want the program to stop because of a simple keystroke error, we trap the error by executing the except block. That block has the one word command of "pass", which means do nothing. The except block must have something in it, so "pass" suffices. So, if you press a letter instead of a number, absolutely nothing happens and you go back to the beginning of the while loop. Once you enter any number, including zero, you exit the loop with the break command with a good value for measurement_interval.
Line 125: These are the sub-directories representing my two temperature sensors. The first one is the breadboard sensor while the second one is on the end of the cable. Since this is all a learning experience, and I was reading about dictionaries, I was going to make this line: device_id = {breadboard: "28-00000400d39d", cable: "28-000004986cbb"}. But, I didn't get around to it. Tuples are pretty efficient though.
Lines 152 - 187: Here is the main loop of the script. I want to discuss the error handling first. The entire while loop is a try block so if any error occurs while executing within the loop, including execution within one of the functions, execution will jump out of the try block (thus out of the while loop) to one of the except blocks following the try block. The first two except statements look for specific errors. The first except statement looks for a keyboard interrupt, as you get by typing CTRL-C. This is one of the two normal ways I have provided to end the script. If, indeed CTRL-C was pressed, the code within that first except block (line 178) is processed and execution passes to line 189, bypassing the next two except blocks.
When executing the read_temp_raw function, if after three attempts we fail to open the w1-slave file, we get to the statement: raise(IOError) (line 67). The raise statement actually creates an error, in this case, IOError. If that indeed occurs, we jump out of the read_temp_raw function, out of the while loop in the main program, and land in the except(IOError) block. After executing the two print statements, we jump to line 189.
If some other, unanticipated, error occurs, execution passes out of the try block, bypasses the first and second except blocks, and lands in the third except block. Any error except a keyboard interrupt, or an IOError will be processed by that bare except statement. The print statement says we have an unexpected error and prints out what that error is. Once this is done, we move to line 189.
Within the while loop
Now let's look within the while loop. If the read_temp_raw function can open w1-slave, it returns the two line contents of w1-slave as a two element list. We check to see if the first line ends in 'YES'. If it does not, which seems to be the case about half the time, we wait a short time (the value of the variable short_wait) and go back to the beginning of the while loop to try again with a new read of w1-slave. If we do find a 'YES' we get the contents of the end of the second line following 't='. If 't=' is not found (rare if ever), we do like we do if 'YES' is not found: simply wait a short time and return to the top of the while loop and try again. If we do find 't=' we read the five digit number following it. That number is divided by 1000 to get the temperature in Centigrade and then converted to Fahrenheit.
After the temperature is found the current time is determined. The temperature and time along with the probe in use is printed to the screen and sent to the print2display function. It was rather a fun endeavor to come up with that print statement. I talked about the string formatting method, strftime, previously. Finding the unicode value ((hex B0) for the degree character was a challange. Finally, the time to wait between measurements is set to the value of measurement_interval inputted by the user.
Previously, I had the code to check the switch in the while loop in the main part of the program. Also, the wait between measurements was implemented, simply, with a sleep statement with the value of measurement_interval. This meant that if measurement_interval was a long time, in minutes or hours, I would have to press the switch at exactly the right time to catch the code outside of the sleep time, or press the switch for a long, long time. With the code in lines 170 - 174, I check the switch every second so the longest time to press the switch before the script stops is one second (actually 1.2 seconds to account for the wait statement in the check_switch function). It is necessary to check the switch in line 170 before getting into the small while loop in case the user selected zero seconds for measurement_interval.
I have just discovered a glitch in this script. If the user selects a negative number or a non-whole number for measurement_interval, that while loop will never get to exactly 0. I'll have to fix that. I should have tested for that before
Finally, how does the switch provide an exit from the script? It does so by the raise(KeyboardInterrupt) statement in line 116. If the switch is pressed, the effect is the same as if the user typed CTRL-C.

Monday, April 8, 2013

16 X 2 LCD Display Times Square Scroll, Continued

This is a continuation of the prior post about the Times Square Scroll display on a 16 character by 2 line LCD Display.  The entire Python code for that program is at the top of that blog post.  I discussed a code fragment for a simplier version that only displays on the top line of the display.  That fragment replaced lines 49 through 75.  It's now time to discuss the two line version.  So that the reader will not have to go back and forth between this post and the last post, I have repeated the code fragment for the top line only display and made a code fragment that corresponds to lines 49 through 75 of the complete program.
Code Fragment for Top Line Only Display
Code Fragment for Two Line Display
Recall in the prior post I showed that it is possible to have a garbled display of the text where previously entered characters on the other display line, and newly entered characters both get displayed.  Recall Fig. 5 from the last post.
There are two opportunities for this to occur with the two line display.  We have the end of the address space situation discussed in the last post.  Recall, if we don't take corrective action, the next character will be displayed on the wrong display line.  That situation will be solved in nearly the same manner as we solved it before.
The end of the address space situation is solved in the four lines, 12 to 15, in the top line only display.  The four lines, 17 to 20, handle this in the two line display.  The code is very similar but the two line display must deal with characters on both lines.  The two line version simply subtracts 28h from the address counter if the address counter reaches 28h or 68h.  I'm going to explain line 18 further in my next post which talks about hexadecimal numbers.
Now let's discuss the second cause of a garbled display.  When we have completed the first pass through the text on the top line, we move down to the bottom line.  However, the characters that we put into the top line memory are still in that memory.  Eventually, as we add more characters to the bottom line, and the Visible Memory window continues to move, the characters that are in the top line memory start to become visible.  When we finish the bottom line, we move to the top line and the old bottom line characters evenually start to show up.  This goes on and on until we push the switch to stop the program from running.
I solve that problem by overwriting the old characters with spaces.  Evety time I finish writing a character to the display, I erase a character before I write the next character.  I could not allow the display to shift automatically after I write a character.  Code line 1 of the top line only version does not appear in the two line version.  After I write a character (code line 11), I write a space to the same address position on the other display line (code lines 12 and 13).  I then restore the address counter back to the line I was writing characters to, and increment the address counter (code line 14, and increment by adding 81h rather than 80h to the address counter).  Finally, I manually shift the display to the left, which moves the Visible Memory window to the right (code line 15).
For example, if I write a character to memory position 10h on the top line, I write a space to memory position 50h, overwriting any character that was there.  Look at Figures 2,3, or 4 in the last post for reference.
Code line 12 of the two line version will be discussed further in the next post.

Wednesday, April 3, 2013

16 X 2 LCD Display Times Square Scroll

Here is a more complex program using the LCD display.  Just watch the video to see what the program does:
Here is the python code:
As you can see, the Times Square Scroll program asks the user to input text.  That text enters at the right end of the LCD display, on the top line, and scrolls to the left.  Once the entire text has gone to the display, it starts over on the bottom line.  Once all of the text has appeared on the bottom line it repeats to the top line.  This continues until the user pushes the switch and stops the process.
There is not a great deal of additional code to make the Times Square Scroll program work.  The shortness of the code, however, belies the fact that it is somewhat complex and requires a pretty good understanding of the 44780 display controller.  Remember that all of the code from the file LCD_2X16.py is imported into this program.
The display controller has two internal memories.  One is the character memory that converts an ASCII character to a pattern of dots that correspond to the letter, number, or symbol you see on the display.  It is the other memory, however, that concerns us.  This memory, called the Display Data RAM, contains 80 memory locations (80 eight bit bytes).  When you send a character to the display controller, it goes into this RAM.
The first 40 memory locations are devoted to the top line of the display, and they correspond to memory addresses 00h to 2Fh.  The bottom line's 40 memory locations are found at addresses 40h to 67h.  The data sheet for the display controller uses Hexadecimal notation for memory addresses, so, I will be using Hexadecomal notation too.  While there are 80 memory locations, only a maximum of 32 characters appear on the display.  Obviously, characters in some some of the memory are visible, and some are not.  To make it easier to determine what is visible, we can define a window corresponding to the visible portion of the memory.  Let's call that the Visible Memory window.  Take a look at Fig. 1, below.  It is a graphical representation of Display Data RAM.  I have indicated the Visible Memory window with a red rectangle.  It is important to know that this window can be moved to display characters in different memory locations, but it will always be the same size.
I am going to talk about sending characters to the memory.  Actually, we will be writing the ASCII equivalent of the characters to the memory.  For example, if we want a space, 20h, or 32 decimal will be written.  We'll keep it simple and say we are sending a space to the memory.
If you want a simple display project, like in my previous blog, you would not need to concern yourself with the Display Data RAM and my Visible Memory window.  Figure 1, shows how the memory was utilized in the previous blog.  The Visible Memory window stayed put and there were never any characters placed in the memory locations that were not visible.  The Times Square Scroll, however, makes plenty use of the Visible Memory window.
Figure 1.
There are two other important memory elements within the 44780 controller chip.  The first is the instruction register.  The commands (as opposed to characters) you write to the controller go there.  Pages 23 through 29 of the controller's data sheet explain the commands quite well.  That other important element is the address counter.  The address counter contains the memory location that will receive the next character.  You can write to the address counter if you wish to change where the next character will go - the code does this frequently.  It is important to know that once you write a character into a memory location, the controller will increment (or decremen) the contents of the address counter.  In this way you don't have to keep changing the address counter yourself.  As a matter of fact, you can't stop the address counter from incrementing or decrementing.
Before we look at the code for this two line version of the Times Square Scroll, I have a simpler version that uses the top line only.  The code fragment, below, replaces lines 49 through 75 above.  It's a little easier to understand.
Let's assume the user has asked to send "Now is the time for all good men to come to the aid of their party" to the display.  Recall that I said you can change the contents of address counter, and that is what I do in line 3 and 6.   I set it to the position just to the right of the Visible Memory window and upload it to the display controller.  In line 1, I commanded the controller to make a left shift after I upload each character.  Line 1 also says to increment the address counter after uploading each character.  If I had been writing in a language that reads from right to left, Hebrew, for example, I would have told it to decrement the address counter.  When I start to upload characters, the first character "N" goes to position 10h.  See Figure 2.
Figure 2.
After uploading the "N", the display does a left shift.  Hitachi considers the shift direction from the point of view of the character.  From my point of view, the Visible Window moves one position to the right.  In effect, it moves the "N" one position to the left.  The "N" is now within the Visible Window, so it appears on the display.  See Figure 3.
Figure 3.
When the "o" is uploaded, the address counter has been incremented to 11h (by the controller), which again, is one position to the right of the Visible Window.  Once uploaded, the "o" becomes visible because the controller shifts the Visible Window. See Figure 4.  This process continues as each character is added to the display.
Figure 4.
What happens once the address counter has gotten to the end of the memory space of the top line (address 27h)?  Lines 12 to 15 of the code handle that situation.  If those lines of code were not there, the address counter would move to the beginning of the bottom line.  As more characters are added, characters that were previously uploaded to the top line, and still in memory, would also start to be visible.  Old characters would be seen on the top line while new characters are seen on the bottom line.  Eventually, old and new characters would be seen on both lines and you get a mess like in figure 5.
Figure 5.
Code lines 12 to 15 along with line 3 address that problem.  We keep track of the address counter, and when it reaches the memory address beyond the end of the top tine (28h), we simply set it to the beginning address of the top line, 00h.  Note that the Visible Window will now split in two parts.  See Figures 6 and 7.
I could have avoided the problem in another way.  I could have told the display controller that I had a one line display. I could have written:
lcd_byte(0x20, LCD_CMD)
By saying I had a one line display, I could have dispensed with code lines 12 to 15.  However, I knew the one line display was going to be a precursor to my ultimate two line Times Square Scroll.  The two line version, also has code similar to lines 12 to 15.
Figure 6.
Figure 7.
That's enough to absorb for now. I'm going to save the rest of the discussion of the Times Square Scroll for the next blog entry.

Wednesday, March 27, 2013

16 X 2 LCD Input Text and Display

Here is a more practical program that asks you to input text and then displays that text on the LCD display.  The challenge here was to parse the input text so that words were not broken up.  Click on the video to see it work:
Here is python code for this program:
I apologize that the name of the program in the video (LCD_Module_1,py) does not match the name in the Gist file (LCD_Disploy2Lines.py). Somewhere along the way, after I made the video, I changed the file name to make the name more meaningful, at least to me.
The program does not take into account individual words of more that 16 characters in length.
Notice line 16 of the code. That makes LCD_2X16.py (discussed in the last post) part of this program.

Saturday, March 23, 2013

16 X 2 LCD Base Code

I am finally getting to the code.  I will spread this over three posts.  The first code will be the base module that will be imported into python programs for two other projects.  The base module can, of course, be run by itself. If it is run by itself, the LCD will display what you see in the photograph in the header of this blog.  
I did not originate the base module.  I based it on the code found at Matt Hawkins blog (referenced previously).  I added to it, made some modifications, and made it more suitable to be imported into other projects.  Matt was not the originator of the code either.  I believe the original code was modified from code for the Audunio and appears in Micky Skyler's Adafruit tutorial, "Drive a 16x2 LCD with Raspberry Pi" that is referenced in the previous post.  That tutorial presents a python class for the display controller called Adadruit_CharLCD.py.  This code is quite comprehensive and I believe others took what they needed from it for their code.  This is my version of that code, my base module:
You will need to have RPI.GPIO installed to control the GPIO pins on the PI.  I believe some distributions already include it.  Micky Skyler's Adafruit tutorial covers how to get it if you need it.  
Lines 23 and 24 are probably for my situation only.  More on this in my next post.  
If you want to understand the code you have to read it along with the Hitachi data sheet for the HD4478U.  Pages 24 and 25 have the pertinent information.  
Lines 40 through 42 of the code are particularly interesting (and I can't take any credit for this code). The HD44780 must be initialized before it can be used.  See Figure 24 on page 46 for the sequence of events to initialize the chip.  There are timing requirements between steps like "Wait for more than 4.1ms".  The PI is slow enough that we don't have to worry about the timing.  
The initialization starts (line 40 of the code) with the controller in 8 bit mode, not four bit mode.  The first two commands have DB7 - DB4 (data bus pins) set to 0011 which corresponds to hex 3, so the first two hex 3's are sent, one hex 3 at a time in line 40. The next two commands are 0011 and 0010, corresponding to hex 3 and hex 2, which are sent to the controller by line 41.  The next line, 0010 specifies 4 bit operation which is hex 2 (8 bit operation would be 0011), while the following line has N = 1 for a two line display and F = 0 for 5x8 dots.  Therefore the forth command is 1000, or 8 hex. Code line 42 sends those two commands, hex 2 and hex 8, to the controller.  I'll leave the rest of the initialization commands for you to figure out for yourself.  
For those unfamiliar with hexadecimal numbers, I plan to devote a post to hex, binary and decimal numbers and bit manipulation.
Line 105, if __name__ == '__main__', was something that I did not understand at first.  I saw quite a few questions about it on forums, so I guess I was not the only person who wanted to know.  Why do we need this line at all?  I need it because I intend to import this base module into a couple of other programs for my next posts.  This will save me from copying lines 12 to 102 into the new programs, and you will only see the new code giving a cleaner presentation.  
So how do you interpret line 105?  You can consider __name__ and __main__ to be python interpreter or internal variables.  When you run my base module, LCD_2X16.py, the interpreter assigns '__main__' to __name__.  Since line l05 evaluates to true, the code following that line will run, outputting the text to the display.  However, I have imported LCD_2X16.py into other programs by writing from LCD_2X16 import * in those programs.   If I then run one of those programs, everything from LCD_2X16.py will be part of the calling program.  However, when if __name__ == '__main__' is reached it will compute to false because __name__ now equals 'LCD_2X16', not '__main__' thus the test code will be ignored.  Pretty neat!  if __name__ == '__main__' is only written in the base module, not my other programs.

Thursday, March 7, 2013

16 X 2 LCD Display Project - Hardware

Programming a display seemed like a good starting project to get my feet wet with the Pi.  The header at the top of this page shows the hardware I purchased for this project.  There is the Adafruit Pi Dish that includes the breadboard.  The Pi Dish becomes the base that holds the Raspberry Pi and the breadboard. I like the fact that the Pi is secured and not just hanging by the ribbon cable. 
And yes, I know, I forgot to remove the brown paper from the top and bottom of the clear plastic of the Pi Dish.  By the time I remembered, I already had evertthing connected.
Connecting the Pi to the breadboard is the Adafruit Pi Cobbler breakout kit.  This is a small PCB that plugs into the breadboard and a ribbon cable that connects the PCB to the Pi's GPIO pins.  Adafruit has another Pi Cobbler with the ribbon cable on the side.  This makes the labels on one side of the PCB easier to read because the cable is not in the way.
The display is a 16 alphanumeric character by two line LCD display by Lumix, purchased from Newark/element 14 electronics.  This is a reflective type display so does not need a backlight.  I kind of wish I had purchased the transmissive type LCD display.  Adafruit has a number of color options for these sexier displays.  Transmissive displays, of course, have a backlight. 
I purchased Adafruit's Wire Bundle to make the connections on the breadboard.  The blue device is a three pin 10K potentiometer used to adjust the contrast.  It would have been better to purchase a 1K pot as the ideal contrast setting is closer to the 0 ohm resistance.  The white, square, device with the black "4" is a momentary switch.  Since my Pi is controlled from my desktop, I use the switch to have the program wait for me to get over to the Pi before having the Pi do its stuff. The blue rectangular device to the right of the switch is an Adafruit, 4 channel I2C-safe Bi-directional Logic Level Converter.  If I want the Pi to read an output from the display, a channel of the converter must be connected between the display pin and the Pi's GPIO pin.  A logic high from a display pin is nominally 5v, which would be fatal to the Pi.   The converter, or level shifter, will convert 5v from the display to 3.3v to the Pi, and 3.3v from the Pi to 5v to the display.  If it is not necessary for the Pi to read a display pin, it is not necessary to use the converter.  The display is capable of interpreting 3.3v from the Pi as a logic high signal.  In the photo in the header, the converter is not wired into the circuit.  I did experiment by reading the "busy" bit from the display.  In that case, I did use the converter.  There will be more on this experiment in a later post.
I was happy to see that a data sheet was available for the LCD display.  However, it does not tell you much beyond the dimensions, electrical characteristics, and pin-outs.  The little block diagram on the second page shows a "LCD Controller LSI and Driver".  You need the data sheet for that device, but they don't tell you what the device is.  I went to the Raspberry Pi's great webpage and used their forum to ask if anyone knew what that LCD controller was.  Rick Seiden responded to my post saying that the chip is a HD44780.  Here is the data sheet for the Hitachi HD44780U.
My next post will discuss connections made between the display and the Pi.