My Pi Description

My Experiences With the Raspberry Pi -- Tracking My Learning -- My Pi Projects

Thursday, March 6, 2014

Gertboard - Pulse Width Modulation - Servo Control

This is really a continuation of my last post. This post carries Pulse Width Modulation further by considering the control of a servo.
There are two types of small servos: a standard type and continuous type. This post describes the standard servo. This is the servo I purchased from Adafruit.
The standard servo has a shaft that rotates to a desired position and stops rotating once that position is attained. It can rotate 180°, or 90° in each direction from a neutral position.
It has a DC motor that connects through a series of gears to the shaft of a potentiometer, a device producing a variable electrical resistance. An extension of the potentiometer shaft is the output shaft of the servo. The set of gears between the motor and the potentiometer significantly reduces the speed of the motor and significantly increases its torque.
As the motor turns the potentiometer shaft, the resulting change in resistance produces a change in voltage. Let's call this voltage "A". Another voltage is produced that comes from translating the width of input pulses to voltage. The input pulses come from your ATmega microcontroller and represent the desired shaft position of the servo. Let's call this voltage "B". Voltages "A" and "B" are compared in a feedback circuit within the servo. As long as voltage "A" does not equal voltage "B", the feedback circuit produces a voltage to turn the motor either CW or CCW. When the motor has rotated the potentiometer to the point where the voltage "A" equals voltage "B", the control circuit stops the motor. As long as voltage "B" does not change, the output shaft will not rotate. A small servo usually can prevent a fair amount of external torque from turning the shaft.
Photo Found On Several Sites Servo As Found On Adafruit's Website
The other type is the continuous servo. This type turns continuously and the PWM controls the direction and speed of rotation. This may be a good alternative to a toy motor as it will be geared down for a more manageable speed range.
The ATmega328P will produce the pulses required by the servo using its Pulse Width Modulation features. In my last post, controlling a DC motor, the pulse repetition frequency was not very critical. This is not the case with the servo. The servo requires a pulse repetition frequency of 50Hz. We need a pulse every 20ms. The pulse duration is also specified and is in the range of 0.5ms. to 2.5ms. All the documentation I had seen for this type of servo specified the range to be 1.0ms. to 2.0ms. My particular servo, purchased from Adafruit, did not come with a data sheet, but apparently has better resolution than the typical unit. Programming from 1.0ms. to 2.0ms. did not turn the shaft 180°. Programming from 0.5ms. to 2.5ms. (confirmed by my oscilloscope) did produce 180° of rotation.
Forget about using the Arduino AnalogWrite() function. This function provides a fixed frequency of either 490Hz or 980Hz depending on the I/O pin. We need 50Hz. for servos.
The discussion below describes my system with a 12MHz clock frequency, and my servo that has a 0.5ms. to 2.5ms. pulse duration range. If your system is different you will have to make the appropriate adjustments.
The first decision we have to make is what timer/counter and prescaler value to use. The decision will be based on having adequate resolution of the angle of rotation. Since we know the frequency of pulse repetition we can rearrange the formula found in my last post. This gives us two unknowns: the maximum count and the prescaler value.
pulse repetition freq = clock speed / (2 * prescaler * max count)
Substituting the known values:
50 = 12,000,000 / (2 * prescaler * max count)
Rearranging and simplifying:
max count = 120,000 / prescaler
The range in pulse width is 2.0ms (2.5ms. at +90° minus 0.5ms. at -90°). This is one tenth of the 20ms. pulse repetition rate (1/50 x 1000). Therefore, the range of programmable count values is one tenth of the maximum count. The rotation resolution is the range of motion of the servo, 180°, divided by the count range. This is summarized below:
Prescaler Max Count Pulse Width Count Range Rotation Resolution
1 120,000 N/A N/A
8 15,000 1500 0.12°
64 1875 187.5 0.96°
256 468.8 46.8 3.84°
1024 117.2 11.7 15°
From the chart above we can eliminate the prescaler value of 1 because the ATmega328 does not provide a timer/counter that can count to 120,000 (65535 or 255). The only way to employ an eight bit timer/counter (timer/counter 0, or 2) is to use the prescaler value of 1024 - the only choice where the maximum count is under 255. However, the resolution of 15° is poor. This means that we will use timer/counter 1 because it can count to 65535. We should go for the best resolution which means that we will use the divide by 8 prescaler. This gives a resolution of 0.12° per count
Next we select the mode. We will select mode 8, the "Phase and Frequency Correct PWM" mode. The value of the maximum count will be programmed into register 1CR1.
The script I wrote is below and the details of register programming is included within the comments. The script requires you to open a terminal window on the host computer - the Raspberry Pi in my case. You are asked to input a floating point number which is the desired degrees of rotation from the middle position. The script accepts values from -90° to +90°. Once it rotates the servo shaft to the angle you requested, it will ask for your input, again.
Inputting a number from the terminal is not a trivial endeavor. The terminal handles one character at a time and it is up to the programmer to make sense of those characters. I did not want the script to be encumbered with the handling of the character inputs so I wrote a library to do that task. I wanted to learn how to do that, anyway, having not done that before. There are only three lines dealing with the character input: line 35 where we include the library dot h file, line 37 where we create an instance of the class created in the library, and line 59 where we call the function to get our number. My next post will report on creating that library function.
The servo has three pins, two go the battery to power the device, and provide a ground reference, and the third is the control pin which receives the output from the ATmega328. Don't forget to connect the ground pin from the battery to one of the grounds of the Gertboard.
The script:

Monday, March 3, 2014

Gertboard - Pulse Width Modulation - DC Motor Control

This post is about using the ATmega328P microcontroller for Pulse Width Modulation. While the subject is covered pretty well in the device's data sheet, some clarification and simplification is in order. This is my intention here. Please have the datasheet available. It can be found here. Select the first pdf file.

What is Pulse Width Modulation

If you landed on this page you probably know, so this explanation will be really short. While you can control a DC motor by controlling the voltage it is connected to, it is usually more precise and actually easier to control the motor by repeatedly turning it off and on. The motor responds to the average time the voltage is applied. You apply the motor voltage as a string of pulses with a defined frequency and a defined pulse width. If the duration of the pulse is half of the duration between pulses, the PWM will be 50% and the motor should turn at 1/2 speed.

To Drive A DC Motor

My last blog entry used Timer/Counter 1 in Normal mode to produce a timed delay. The timed delay function only had to use the timer/counter to do one thing: count up to a value and issue an interrupt. Pulse width modulation has two requirements. It must establish a frequency of pulse repetition and control the width of the pulses. While interrupts can be generated, PWM typically controls the logic level of a pin, or pins, that connect to external devices. Let's start with the dc motor being that external device.
We have plenty of options to consider. The first is whether we can use an eight bit timer/counter or do we need a 16 bit timer/counter. The answer is we probably don't need all of that resolution to control a dc motor. We can use ATmega's timer/counter 0 or 2 - both 8 bit circuits. Let's use timer/counter 0.
Next we need to decide between two major PWM modes. One mode gives twice the maximum frequency of pulse repetition as the other. This "Fast PWM Mode" operates by having the counter count up, and when it reaches its upper value, the counter starts over at zero. If you were to graph count against time, you would see a sawtooth wave. The other mode, "Phase Correct PWM Mode" has the counter count up, and when it reaches its upper value, count down at the same rate. When the count reaches 0 it counts up again. Graphing this looks like a triangular wave. See my graphic below.
Why are there two modes? If you never change the motor speed, either mode is fine. If you do change the motor speed, the Phase Correct PWM mode always has the center of the pulse at exactly the same place in time (if you keep the pulse repetition frequency the same and only change the pulse width). When changing the speed in Fast PWM the center of the pulse will move. Phase correct PWM results in a smooth transition in speed, while Fast PWM is more abrupt. Motors like the former over the latter. My example will use the Phase Correct PWM
With that settled, we have to deal with the frequency of pulse repetition. I don't know enough about DC motors to say what is the best frequency of pulse generation. I guess if the frequency is too low, the motor could lose speed between pulses. I don't know if there is a down side of too high a frequency. The higher frequency could limit the resolution of the speed differences we can program. This will be clear soon. The frequency of pulse repetition rate is determined as follows:
Pulse repetition frequency = clock speed divided by the prescaler and divided again by the maximum count set into the timer counter and finally divided by 2
My clock speed is 12MHz and the possible prescaler values are 1, 8, 64, 256, 1024 (allowable values for timer/counter 0). The lower the prescaler value the higher the frequency. The lower the count also gives you higher frequency. A little drawing is in order here:
The slope of the triangular waveform is determined by the clock frequency and the prescaler value. The clock frequency is your system clock so is not a variable. The prescaler value is, however, programmable. The horizontal line at the top, "Frequency" is controllable by your program and represents the maximum count in the timer/counter. It should be clear that changing the maximum count changes the pulse repetition. If you lower the count, the peaks of the triangles move to the left decreasing the time between pulses. Generally, when you decide on a pulse repetition rate, you would keep that constant.
The lower horizontal line, "Pulse Width", represents the width of the pulses. Typically, this value changes during your application. For example, if your project is a car with dc motors controlling two wheels, you frequently alter the speed of the car. And, you could steer the car by differentially changing the speed of each motor. Therefore, the width of the pulses frequently change. The graphic above should make it clear how the width of the pulses are changed. Lower the horizontal line and the width of each pulse decreases (assuming the we are talking about the positive going rectangle).
Note that the count for the "Pulse Width" must be less than the "Frequency" count. The "Frequency" count then determines the resolution of the pulse width modulation. If the "Frequency" count is the maximum allowed, which is 255 for timer/counter 0, each count will correspond to a pulse modulation increment of about 0.4%. If you lowered that "Frequency" count to 10, you would only be able to program PWM in 10% increments.
There is another programmable selection. The "Resulting Pulses" in the graphic are the result of selecting: clear (go low) on a compare match when counting up, and set (go high) on a compare match when counting down. The compare match value is represented in the above graphic by the line "Pulse Width". You can also program the opposite action: set on a compare match when counting up, and clear on a compare match when counting down. If you program that option, the "Resulting Pulses" waveform would be turned upside down.

Putting It Together In a Script

I did a small sample project where I control a toy DC motor. Since my ATmega328P resides on my Gertboard, I connect the motor and a 6V battery (4 AA's) to the BD6222HFP H-Bridge motor controller. This isolates the motor and it's power source from the PI and the Gertboard. My project increases the motor speed from off to full on, decreases the speed to off, changes the direction of the motor, increases the speed to the max and reduces it to off again. This action is repeated continuously.
There are only two timer/counter 0 modes for Phase Correct PWM, mode 1 and mode 5. My project uses mode 5. Compare register OCR0A controls the "Frequency". If I use mode 1, the "Frequency" count would be fixed to 255. Using mode 5, I can select any value from 0 to 255. As it so happens, I chose 255 anyway. If I had two motors to control, I would choose mode 1. In that case, compare register OCR0A controls one motor and OCR0B controls the other. Pulse repetition frequency would be the same for both motors but each would have it's own PWM percentage. They could turn in the same or opposite direction from each other.
The pulse repetition frequency of this project is 12,000,000 / (2 * 64 * 255) = 368 repetitions per second.
The H-Bridge takes two inputs. One input gets the pulses from pin PD5 while the other input comes from pin PD7. PD7 will determine the direction of rotation just like reversing the leads to the motor. When PD7 is low, we will select clear on a compare match when counting up, and set on a compare match when counting down. When PD7 is high we select set on a compare match when counting up, and clear on a compare match when counting down. You can picture how this works by considering how you would stop the motor. The motor stops if both PD5 (PWM = 0%) and PD7 are the same polarity.
The script below has a lot of comments (more comments than code) so I think the details are well presented within the script.

Wednesday, February 12, 2014

Gertboard - Creating Delay Function With Timer/Counter

My last blog post mentioned that the Arduino built-in delayMicroseconds() function was very inaccurate. The error was a whopping 50% when measured with an oscilloscope. As I wanted to investigate some of the intricacies of the ATmega328P registers I thought to write my own delay function.

Counter - Timer Features of the ATmega328P

There is tons of information on the web about using the ATmega timer/counters so the following will be a bit sketchy. The datasheet is a must to have available when talking about the ATmega functions. However, the datasheet is rather terse so sometimes you have to read between the lines, experiment like I am doing, or read of someone else's experience like you are doing here.
There are three timer/counters on the chip: 0, 1, and 2, They all have somewhat different features. Timer/counter 0, and 2, are eight bit counters so can only count up to a maximum of 255 (28). Timer/counter 1, has a 16 bit counter so can count up to 65535 (216).
Timer/counters 0 and 2 are almost identical. It seems that the intended use for timer/counter 2 is as a real-time clock. It kind of assumes that a 32 kHz watch crystal is connected to pin TOSC1. However, on the Gertboard, and most Arduinos (as far as I know) The 12 or 16 MHz resonator is already connected to that pin. Timer/counter 2 does have six prescaler (clock divider) selections while 0. and 1 have five.
Timer/counter 0 and 2, with their eight bit counters are well suited for controlling motors by pulse width modulation (PWM) while timer/counter 1 is best for servos and things my delay project. Timer/counter 0 and 2 have four modes of operation, a "Normal" mode, a "Clear Timer On Compare Match Mode" (CTC), and two pulse width modulator modes. Timer/counter 1 has all the modes of the other two with an additional PWM mode.
In all but two of the modes, the counters in the timer/counter circuit count up with each clock pulse received. When it reaches either its maximum value (255 or 65535), or a value you program, it starts over from zero. For pulse width modulation, you use the counter to establish a period of time. But, that only gives you half of what is necessary to control motor speed. For each time period, you need to control the percentage of time that you provide voltage to your motor. To provide that functionality, each timer/counter has two comparators (8 bit for 0 and 2, and 16 bits for timer/counter 1). You program a value into a comparator and when the count in the counter matches that value, the state of the I/O pin associated with the Timer/counter/comparator changes. When the counter reaches it's top value and returns to zero, the state of the I/O pin changes again. This results in two changes of state in each counter cycle (OFF to ON, and ON to OFF or ON to OFF, and OFF to ON). There are two modes where the counter counts down as well as up. Here, the state of the I/O pin changes when the counter count matches the comparator while counting up to its maximum value and matches it again on its way down to zero.
Since there are two comparators, each timer/counter can control two I/O pins. You can control two motors or two servos from each timer/counter circuit. The period (cycle time) would be the same for each because there is only one counter. However, each I/O can have its own percentage of ON/OFF time (because each has its own comparator).
Beyond controlling I/O pins, the Timer/counters can be programmed to issue internal interrupts. That is the feature I use for my delay script. Each of the three timer/counters has three interrupts. For the modes where the counter only counts up, and then resets to zero, an interrupt is issued when the counter overflows - when it reaches its maximum value (255 or 65535). At the next clock pulse the counter resets to zero and the overflow flag interrupt is issued. For the two modes where the counter counts up and then down, the overflow interrupt is issued when the counter reaches the bottom (zero). The interrupt routine you write will clear that flag.
The timer/counter can also be programmed to issue an internal interrupt when the counter count matches the comparator value. Since there are two comparators for each timer/counter, each has two of these interrupts.

My Counter Project

My code:
I use the timer/counter 1 in Normal mode and do not connect to either I/O pin. I don't use the comparator. I use the overflow flag interrupt. When my function is called, I do the following:
  1. The circuit only works for delays up to just over 5 seconds. If more is asked for, the maximum is substituted for the passed value.
  2. The most advantageous prescaler is selected depending upon the passed value. The lowest value possible is used to give the maximum resolution.
  3. The value of the count to be programmed into the time/counter 1 counter is calculated.
  4. A value of 1 is passed into the GPIOR0 register.
  5. Interrupts are turned off
  6. The two control registers associated timer/counter 1 are cleared assuring that the clock will not be connected to the counter (Counter will not count).
  7. The counter is programmed with the value calculated in step 3.
  8. Timer/counter Overflow Flag Interrupt is enabled.
  9. The prescaler is selected according to the variable "msk". This starts the clock. The clock now starts to count up with from the value we programmed into it (step 7.).
  10. Interrupts are enabled.
  11. We go into an endless loop waiting for the interrupt.
  12. The interrupt is issued one clock pulse after the counter reaches its maximum value of 65535.
  13. Processing enters the interrupt service routine which clears the interrupt.
  14. The value of GPIOR0 is set to zero.
  15. The prescaler is set to None value which stops the clock
  16. The Overflow Flag Interrupt is disabled.
  17. We exit the interrupt service routine and go back into the endless loop.
  18. Since GPIOR0 is now not 1, we exit the endless loop and the function.
The prescaler divides the 12MHz clock. For example, if the prescaler is set to 8, it takes eight clock cycles of the 12MHz clock to send one clock pulse to the counter. The available prescale values are None, 1, 8, 64, 256, and 1024. NONE disconnects the clock from the counter. If the prescaler is set to 1, it takes 65536 / 12MHz or 5461.3 microseconds to count from 0 to 65536 (65536 is equivalent to 0). The maximum delay for the function is obtained when the prescaler is 1024 and the variable "count" is 0, which would be 65536 x 1024 / 12MHz which is 5592405.3 microseconds or 5.5924053 seconds. Any value passed to the function greater than 5592405.3 is set to 5592405.3. I guess I could have extended the time indefinitely by waiting for multiple occurrences of the interrupt before exiting the endless loop. I saw no need to do that because the built-in delay() function is pretty accurate.
In step 3. above, I make use of the GPIOR0 register, one of three general purpose I/O registers. These registers can be used to store any information. I use it here instead of using another variable. If I had used a variable, instead, that variable would had to be declared as volatile. If I had written line 75 as "while (somevariable == 1);", and had not declared "somevariable" as volatile, the compiler would have thought the line did nothing except create an endless loop and would have eliminated it. The use of the register is kind of handy.
There are control bits that need to be programmed: Four WGM1 (waveform generator mode) bits, and two sets of two COM1 (Compare Output Mode) bits. One set of COM1 bits correspond to each comparator circuit. In this application, WGM1 is programmed to 0b0000, which selects Normal mode. Both COM1 sets are programmed to 0b00, which disconnects the two I/O pins associated with timer/counter 1 from the two timer/counter 1 waveform generator circuits. The four COM1 bits, and the lower two bits of WGM1 are part of the TCCR1A register (other two bits are not used). Therefore, TCCR1A is programmed to 0. The two higher order WGM1 bits are bits 3 and 4 of the TCCR1B register. Bits 0, 1, and 2 of TCCR1B are devoted to the prescaler. The value in the variable "msk" is used to program these bits. The range of possible values of "msk" is only be 0b00000001 through 0b00000101 (1 through 5), which keeps the bits 3 through 7 as a "0".
The overflow interrupt is selected to be enabled when interrupts are enabled. The prescaler is loaded with the value in "msk" which starts the counter counting up from the value in "count". Interrupts are enabled and we enter the endless loop. When the counter overflows (next clock after reaching 65535) the interrupt occurs and we leave the endless loop and enter the interrupt service routine. The interrupt service routine changes the value of GPIOR0 and stops the counter from counting. We leave the interrupt service routine and return to the endless loop. Since GPIOR0 is no longer 1, we leave the loop and leave the del() function.
In the next blog post I will discuss PWM. using the timer/counter features of the ATmega328P.

Sunday, January 19, 2014

Gertboard - Programming With ATmega Registers

Arduino IDE Built-in Functions Vrs. Direct Register Programming

Functionally, what is the difference between this script:
and this script:
Answer: NOTHING
Note: In the sketches discussed here, to see if the LEDs on the Gertboard are ON or OFF, PB0 is connected to BUF1, PB1 to BUF2, PB2 to BUF3, PB3 to BUF4, PB4 to BUF5, and PB5 to BUF6.
Both scripts turn LEDs on the Gertboard ON and OFF. First, LEDs 1, 3, and 5 are ON with 2, 4, and 6 OFF. One second later, 1, 3, and 5 are OFF, and 2, 4, and 6 are ON. One second later, the process repeats itself, on and on. The first script uses functions built into the Arduino IDE. While the second script uses the Arduino IDE delay() function, the LEDs are controlled by writing directly to microcontroller registers. The second script is sure a lot shorter and takes up about half of the space in memory. I must admit that it does use a little trick that I'll discuss later. That trick can not be used with the first script. I tried to shorten the first script by using for loops and if/else statements in lines 12 - 27. I gave up because it didn't seem to save lines of code.
The built-in functions that are part of the Arduino IDE are a convenient way to interface with the ATmega I/O pins. The second script shows another method, and that is to communicate directly with registers within the microcontroller associated with those I/O pins. Registers are eight bit bytes that are addressable within the ATmega memory space. In most cases, each bit of a register can be either read or written to. Each bit, or a combination of bits control some function or produce some effect. Before you can deal with these registers you need knowledge of what the registers do. That knowledge comes from the ATmega datasheet from Atmel.
If you are not concerned about writing a few more lines of code or how many bytes get loaded into the microcontroller, what other reasons would there be for programming ATmegta registers? Here are a few reasons:
  • IT'S EASY TO DO. There is a library include file, iom328p.h for the ATmega328P, that defines all of the registers and register pins in exactly the same way that they are named in the datasheet. For example, in the second sketch, the line "DDRB=0b00111111;" correlates directly to 13.4.3 on page 92 of the datasheet. This is the datadirection register for port B. Writing a 1 to the lower six bit positions makes pins PB0 to PB5 outputs. "PORTB=0b00101010;" correlates to 13.4.2 on page 92. This will make PB1, PB3, and PB5 logic high, turning on their respective LEDs. The first line of that second script, "#include <avr/io.h>" looks to see what ATmega chip you are using and, in our case, the ATmega328P. When the script is compiled, the definitions in iom328p.h are used to figure out the locations within the ATmega to access.
  • There are things you can do that are not supported by the built-in functions. For example, even though you can do PWM to control a motor using analogWrite(), you are stuck with one frequency - about 490Hz. If your motor would rather work at 10khz, you can program the counter registers. There are a lot more things you can do or develop yourself. For instance, I wish to develop my own 1-Wire interface for use with my DS18B20 temperature sensors.
  • I found that the function delayMicroseconds() produces delays that area about 2/3 of the correct values. I noticed this first with my camera remote control project. I was looking for a pulse width of 284usec but had to program delayMicroseconds(415) to get 284usec. Testing with an oscilloscope, from a desired delay of 10 to 3000usec, I consistently measured about 67% of the desired value (the delay() function is pretty accurate). So, I plan to write my own function for microsecond delays. There are two 8 bit counter/timers and a 16 bit counter/timer accessible by registers that can be utilized.
  • For me, I like getting closer to the hardware when programming. It makes me feel more in control.
  • Gives me a chance to use those fun bitwise operators like OR, AND, and EXCLUSIVE OR and shift bigs right and shift bits left.
  • Here are most of the ATmega functions that are accessible through registers:
    • I/O Pins, both content, data direction, and pull-up resistors for inputs
    • The various counter timer registers and prescallers for 8 and 16 bit counter/timers. These also control the PWM oscillator functions at the I/O pins
    • SPI control, status, and data registers
    • Registers for the serial communications using the USARTs
    • Registers for the 2-Wire serial interface
    • Analog comparator
    • A to D converter
    • Interrupts
I said I like to use bitwise operators, and the EXCLUSIVE OR operator is the trick I used to make that second script so short. Line 7 turned three of the six LEDs on (PB1, PB3, and PB5). Line 12 is going to toggle those LEDs that are ON to OFF and those that are OFF to ON.
Line 12 uses a compound operator. Recall that =+ is a compound operator. The expression A =+ 1 is the equivalent to A = A + 1. In our line 12, the compound operator is =^ which is an EXCLUSIVE OR. It is the equivalent of PORTB = PORTB ^ 0b001111. The EXCLUSIVE OR compares two bits. If they are the same (both 0 or both 1) the result is a 0. If they are different, the result is a 1. Let's apply that to PORTB which we will assume is 00101010. Putting one number under the other let's see what we get:
  00101010 PORTB
  00111111 EXCLUSIVE OR with this binary number
  00010101 NEW PORTB value
Let's do that again:
  00010101 PORTB
  00111111 EXCLUSIVE OR with this binary number
  00101010 NEW PORTB value
Note we are back to where we started. I hope you can see that this operation will toggle the six LEDs ON and OFF.

Another Sketch Writing To I/O Pins

I would like to introduce another sketch. This one uses four bitwise operators. Between the two sketches we will have used all of the bitwise operators except for the shift right.
This sketch uses the same six LEDs on the Gertboard except only one LED is lit at any one time. It starts with all LEDs OFF, then lights each LED for one second starting with the LED connected to pin PB0. Each LED, down the line, is ON for one second. One second after PB5 is lit, the sequence starts over again at PB0.
Let's take a look at line 12. Here we have two bitwise operators, an OR compound operator, |=, and a SHIFT LEFT, operator, <<. If you are not familiar with this type of notation it surely looks strange.
Line 12 means we are going to take the current contents of the register PORTB, the register connected to pins PB0 through PB5, and OR them with some value so that PORTB is changed. I'll talk about what OR means in a minute. For now, the question is: what is that value we are going to use to change the contents of PORTB? Why, it is (1 << PORTB0), of course. What?? What does that mean? If you look into the include file, iom328p.h, (called by avr/io.h, the first line in the sketch) you will find that PORTB0 is defined as 0. In like manner, PORTB5 is defined as 5. You can see the pattern here. So, (1 << PORTB0) becomes (1 << 0). That means we take the number 1 and shift it left 0 times. That seems to make even less sense. It begins to make sense, however, if we look at 1 as 00000001. Nothing much happens to it if we shift it 0 times as in line 12 of the sketch. But, what about similar line 32. This means we shift 1 left by 5. Just move that 1 over 5 places to the left. This new value now becomes 00100000. Get it?
Now, we can talk about the OR operator. When we OR two binary digits, if either digit is a 1, the resulting value is a 1. A 0 result only corresponds to both digits being 0. So, if we started out with PORTB as 0b00000000 (all LEDs OFF) let's apply sketch line 12 and see what happens.
  00000000 PORTB
  00000001 OR with this binary number
  00000001 NEW PORTB value
This obviously turns the LED connected to PB0 ON, and that is the only one on. Now we wait one second and move on to sketch line 15, which is similar to line 12, except that the |= is replaced by &=, the AND compound operator. And, (1 << PORTB0) is now: !(1 << PORTB0). The exclamation point is the NOT symbol, for negation, another bitwise operator. We know that (1 << PORTB0) is 00000001. What then is !(00000001)? The answer is 11111110. Every bit is changed to its complement (1 becomes 0, 0 becomes 1).
The AND bitwise operator takes two bits and if either is a 0, or both are 0, the result will be a 0. The only way to get a 1 is if both bits are 1. So let's AND the contents of PORTB, 00000001, with 11111110:
  00000001 PORTB
  11111110 AND with this binary number
  00000000 NEW PORTB value
This turns the PB0 LED OFF. Obviously we could have written PORTB = 0; with the same effect, but what is the learning value in that? If you follow the logic you can see where sketch line 16, and beyond, turns the LED connected to PB1 one, for a second, before turning it off, and turning the next LED on, etc., etc.
Controlling those LEDs the way I did in that last sketch is rather silly. Lines 12 through 35 could have been written as:
PORTB = 0b00000001;
DELAY(1000);
PORTB = 0b00000010;
DELAY(1000);
      .
      .
      .
PORTB = 0b00100000;
DELAY(1000);
So why did I write all of that extra code? I wanted to illustrate the use of those bitwise functions because they are invaluable when writing to registers and memory. They are an elegant way of accessing individual bits in a field of other bits (our field is 8 bits because all ATmega registers are eight bits long). It's a way of altering some bits while leaving other bits alone. You could keep track of all the bits in a register at all times, but sometimes that is not possible. Other processes, either hardware or software, could change some bits in a register. You only want to access the bits you want to change and leave the others alone.
As you can see from what we have done before, if you wish to make a bit a 1, or assure it is a 1, OR it with a 1. OR the bits you don't want to change with a 0. Look at the example above.
If you wish to make a bit a 0, or assure it is a 0, AND it with a 0 and AND the others with a 1 to leave them alone. If you wish to toggle a bit, changing it from a 0 to a 1, or a 1 to a 0, EXCLUSIVE OR it with a 1, and EXCLUSIVE OR the others with a 0. If you study the examples above you can see how that works.

Sketch To Read From I/O Pins

I talked about writing to I/O pins in the previous sketches, so my last sketch shows an example of reading the logic level of an I/O pin:
This sketch sets pins PC0 to PC5 as inputs. Writing to PORTC will determine if an internal pull-up resistor will be connected to the pin. Writing a 1, connects the pull-ups. So writing 3F, in hexidecimal, writes a 1 to the lower 6 bits of the register.
Every second, the script sends the contents of PINC to the serial monitor running on the Pi. If PORTC is the register that outputs a logic level to the port C I/O pins, PINC is the register that records the logic level of external inputs of the port C I/O pins. If nothing is connected to an external pin, the internal pull-up resistor will set a logic 1 in the corresponding PINC register bit. If you connect that pin to ground, a logic 0 will be set in the register bit. Using the BIN built-in constant, will send the contents of the register in binary format.
If there is nothing connected to any of the port C pins, you will see:
  111111
  111111
  111111
etc.
However, if you connect PC0 to ground, for example, you will see:
  111110
  111110
etc. for as long as the ground is connected.

Wrapup

I hope this has been informative and if you are a beginner that you learned somethings useful.

Saturday, January 11, 2014

Gertboard - Changing ATmega328P Resonator Frequency

In my last post about my Camera Remote Controller project, I said I would discuss changing the ATmega resonator frequency.

Why Change The Frequency

Now why would you want to do that? Here is a good reason why: once you program the ATmega microprocessor via the RaspberryPi/Gertboard programmer you can remove the chip from the Gertboard and install it on your own PCB. That is what I did to make my Camera Remote Control project become useful rather than being a collection of loose parts and connections. Freed from the Gertboard you are no longer restricted to using a 12MHz external frequency source. You could power your project from 5V rather than the Gertboard's 3.3V allowing you to use a 16MHz resonator or a 16MHz crystal. Perhaps you found a script that was written for an Arduino that you would like to use. Most Arduinos run on 16MHz not 12MHz.
I got interested in this question because I stupidly ordered a bunch of 10MHz resonators. I did this because I failed to check the schematics and THOUGHT the resonator was 10MHz, not 12MHz. I discovered my error but figured the camera remote would work OK at 10MHz, so I wondered how the frequency is set.

Importance Of Clock Frequency

I guess I should talk about why the clock frequency is important. It's important if you are doing any timing. Timing is accomplished by using one of the Arduino IDE builtin functions such as delay(), delayMicroseconds(), micros(), and millis(), or by writing your own timing functions. It's also a consideration if you want to have a script work exactly the same on and off the Gertboard. If you have a project where the timing is not critical, and speed is not a factor, you could forget about an external clock source and use one of the ATmega internal clock options. More on this later.

Let's Change The Frequency

OK, if I still have your interest, what do you do if you want to change the clock frequency? Where is the clock frequency set? It is not set by programming any of the fuses or by programming any of the ATmega registers. It is set when you compile your script from whatever makefile is in use. Let's be clear about one thing here, I am talking about writing scripts, compiling them, and uploading them using the Arduino IDE. If that is the case, the makefile seems to be hidden from view. At least, I could not find it. However, there is a way to find out what is going on when you compile a script.
Bring up your Arduino IDE and go to "File/Preferences", then enable "Show verbose output during compilation". Compile any script. You will find it takes much, much longer and a lot of messages scroll by at the bottom of the window. You should see calls to avr-g++ and avr-gcc, each with several of parameters. One of those parameters will be "-DF_CPU=12000000". OK now that we see that, how do we change it? To answer that you have to know where the makefile knows that the parameter should be 12000000. It finds that information in the following file:
      /usr/share/arduino/hardware/arduino/boards.txt.
boards.txt contains configuration information for products that can use the Arduino IDE like the Gertboard. You can find sections for the Arduino Uno, the Arduino Nano, the LilyPad and many of others. Heading the file are the two sections for the Gertboard which were probably added by Gordon Henderson. One section is for each of the two ATmega ICs you could use with the Gertboard: the ATmega328 and the ATmega168. Assuming you are using the ATmega328, the line in boards.txt we are looking for is this one:
      gert328.build.f_cpu=12000000L.
To change the frequency, simply change the 12000000 to some other value. But, if you compile a sketch, change the value of f_cpu, and immediately recompile your sketch, you will not see a change (in verbose mode) to the parameters of avr-g++ and avr-gcc. When you recompile the same sketch that you last compiled, the Arduino IDE attempts to speed things up a bit (so it doesn't try your patience), and, apparently, does not look at boards.txt again. So, after changing board.txt, compile a different sketch or kill and restart the IDE. Then, you will see the change to -DF_CPU. As usual, make a backup copy of boards.txt before making any changes.
I tried this out by writing a sketch to toggle an LED on and off at a one minute rate. Changing the clock frequency as described above altered the cycle time in a predictable manner.

Changing The Clock Source

I have not personally tried changing the clock source as described in the following. But, I don't see why it would not work.
If timing is not important and your project does not have to work at lightning speed when you remove your ATmega chip from your Gertboard, and install in in your own hardware, you do not really have to install a resonator or crystal.
Before I continue, I strongly suggest you have a copy of the datasheet (it's hardly a sheet, it's 660 pages) for the microcontroller. You can find it here from Atmel. Make sure you download the first .pdf file under the picture. I'll assume you have this handy in the following discussions.
From Table 9-1 on page 27 you can see that, besides the three external clock options, there are two internal clocks built into the chip: a "Calibrated Internal RC Oscillator", which runs at 8MHz, and an "Internal 128KHz RC Oscillator". The default selection is the 8MHz calibrated oscillator. There is also a prescaller that divides the oscillator by any one of the eight values shown on Table 9-17 on page 37. The default value is to divide by 8. This prescaller will also divide the frequency of any of the external clock choices you may have choosen.
If the default choice is the 8MHz oscillator divided down to 1MHz, how does the Gertboard run at 12MHz? The answer is: The Gertboard does not use the default settings if you followed Gordon Henderson's direction for setting up the ATmega chip before using it. Whenever you use the Gertboard for the first time, or install a new ATmega chip on the Gertboard, you run a program called avrsetup. avrsetup programs several registers within the chip, namely the three fuse registers and a lock byte. We won't be talking about the lock byte because avrsetup just programs the lock byte to its default configuration.
If you are younger than about 50, you might wonder why they are called fuse registers. Miorocontroller chips, as well as other chips, like old PROMS (programmable read only memory), would be programmed by burning out fuseable links within the chip. A popped fuse represented a logic 0 while an intact fuse was a logic 1. Once the chip was programmed and you wanted to revise the information, you threw out the old chip and programmed a new one. I don't think any modern devices have fuses - but the name has endured. Mainly, these registers contain settings you want to setup before you do any serious programming because making changes later could mess up what you already programmed.
avrsetup programs these fuse registers for you by calling a program called avrdude. The three registers are the "Extended Fuse Byte", the "Fuse High Byte", and the "Fuse Low Byte". These are all eight bits in length. You can see what these registers do in section 28.2 starting on page 286. If you compare these registers with avrsetup you can see that the extended and high fuse registers are left at their defaults.
The low fuse register is definitely changed. The default value is 0x62 specifying the 8Hz calibrated oscillator and prescaller set to divide by 8. See Table 28-9 on pages 288 and 289 and Table 9-1 on page 27. avrsetup changes that setting to 0xE7 which selects the "Full Swing Crystal Oscillator", for the 12MHz resonator on the Gertboard, and prescalling set to 1.
Like boards.txt, avrsetup can be changed by the user. But, please, make the changes carefully and make a backup of avrsetup. If you would like to accept the 8MHz calibrated oscillator divided by 8, don't run avrsetup at all because all of the fuse registers and the lock byte will be set to the factory defaults.

Monday, January 6, 2014

Camera Remote Control - Free To Move

Last August I published four posts about my camera remote control project. I have a remote receiver/transmitter for actuating the shutter of my Canon G1X. The project was to replace the transmitter so I could control the shutter with a motion detector. Luckily I was able to find out that the receiver works at 433MHz.
The heart of the system consists of a 433MHz transmitter, a motion detector, and an ATmega328P microcontroller IC. Everything connected to my Gertboard, which sits atop my Raspberry Pi. The project was very successful but not terribly useful because it was basically a bunch of loose components and wires. And, it was tethered to a power cord. Here is what it looked like:
To make it useful, everything had to be separated from the Gertboard, RaspberryPi, and AC power. That's possible because the microcontroller, once programmed, retains its program. It was then just a matter of carefully removing the microcontroller from the Gertboard, wiring everything up, and putting it in a box. Oh, and using battery power rather than AC. Here you can see the completed camera remote in its enclosure and a really short demonstration of it in action:
And here is a photo of the inside of the box:
The circuit is built up on Adafruit's Perma-Proto Half-sized Breadboard PCB. The schematic follows here.
The original project used two LEDs that were part of the Gertboard. Of course, these were not available in the stand alone version, so I added two LEDs to the circuit. As before, one LED tracks the output of the motion detector. When the motion detector is triggered, its data signal output goes high for about a second. This time is variable and is controlled by a potentiometer on the detector PCB. This hold time prevents a series of rapid triggers. On the video above, that is why you see that LED on for about a second. The other LED is only on for the time it takes to send patterns to the RF transmitter - a very short time. In the video you have to look closely to see this flash. The LEDs are mounted in the top of the enclosure.
You can follow this link to see the diagram of the project as it was on the Gertboard, and to find links to the RF transmitter and the motion detector.
When it comes to purchasing components for these projects we always seem to mention Adafruit, SparkFun, and Element14/Newark Electronics. However, I find the best place to go for general electronic parts and hardware is Digi-Key . I could not find the enclosure, 12MHz resonator, and many of the nuts and bolts I needed elsewhere.
The Gertboard uses a 12MHz resonator, which I found was not a common part. 10MHz and 16MHz can be easily found. I wondered what to do if I decided to use a resonator of another frequency rather than 12MHz. I will report on that effort on another blog post. I did use the 12MHz resonator and was glad I did. I'll also report on that in a separate post.
The enclosure for the project is a Bud box. Digi-Key has a good assortment of these enclosures.
You may notice rather large series resistors for the LEDs - 10Kohm each. This limited the current to the LEDs to about 1ma. This was just fine because I used clear LEDs so it doesn't take much light to be visible. This also limited the battery current draw.
I used three AAA batteries in series to produce 4.5V for the project. The battery holder came from Adafruit and, unfortunately for me, had an on/off switch. The switch was in the way because it was on the side of the battery holder that I superglued to the side of the enclosure. It took a bit of work to remove enough of the switch to make it flush. The plastic was tough. Also, the width of the holder was about 1mm too wide. This interfered with the lid of the enclosure. I had to use a belt sander to take a little bit of plastic away. It wound up being a mess, and I need tape to hold the battery compartment lid on. The batteries should last a pretty long time. The circuit draws about 9ma. During the time the motion detector is triggered, the current rises to about 12ma.

Tuesday, November 12, 2013

Adding Graphical Users Interface to Graphing Temperature Measurements

I started a series of blog posts back in July about making temperature measurements with sensors using the one-wire interface to the Pi. I described the hardware, software requirements, and the python script I wrote to make and report the measurements.
Earlier this month, I added graphing capability using RRDtool and PyRRD. The python script is, of course, included. Prior to that post, I presented a tutorial on programming with RRDtool and PyRRD. The graphical results are pretty impressive. My only complaint concerns actually running the script. Before making any measurements, the user has to answer quite a few questions that appear on the terminal. Answering all of those questions, each time I run the script, got a bit tedious, so I thought about adding a graphical users interface, i.e. popping a window for those questions and answers. This post reports on those efforts.
Before proceeding any further, I hope you readers have taken a look at my post proceeding this one (Oct. 18). While developing and testing my GUI I ran into a serious problem. The script must be run from root because of access to the the GPIO hardware on the Pi. I found that Linux would not give me permission to access the graphical system running as root. Look at that post to see how that problem was handled.
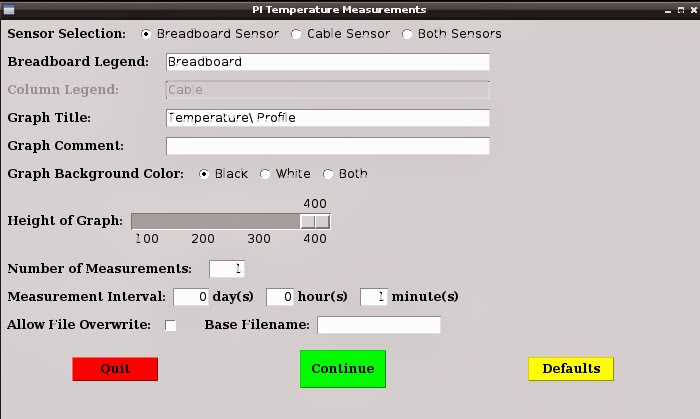
When you launch the script here is the default window that pops up. I'll talk about why I mentioned default window in a little bit:
Taking this from the top of the window, I'll discuss each of the widgets, in turn: I have two temperature sensors, one on the breadboard the other on the end of a cable. With the radio buttons I can choose either sensor, or choose both sensors. You might think two check boxes would be more appropriate than the three radio buttons. But, the radio buttons work better with the program that actually makes the measurements (the program that calls for the GUI window).
Next are two entry boxes for applying a legend to the graph for each sensor. The default has only the breadboard sensor enabled because of the radio buttons selection above, which is why the cable entry box is grayed out. Select cable sensor and the entry box for cable can be edited and the breadboard entry box is grayed out. Select both sensors and neither entry box is grayed out. If you don't type anything in the entry boxes the default text (as shown) will appear on the graph. RRDtool has its own rules and some may seem strange. Here, for example, if you wish to have a colon in your legend (cable: water temperature), you must escape the colon with the backslash character (cable\: water temperature).
After the legend comes the title for the graph. A default string is included. RRDtool does not require you to escape colons in the title, but does require you to escape spaces.
Comments are optional. You must escape colons here too, just like the legends.
Next we can choose the graph background color. Black, I think, looks good on the screen, but if you wish to send the graph to your printer, it would use an awful lot of ink. Consequently, we have an option of having a graph with a white (actually light gray) background, You can choose to create both graphs if you wish. In the future, I would like add the possibility of a custom color graph. That would have new windows popping up from the basic window, something I want to try coding. Like the situation with the sensor widgets, check boxes might seem to be more efficient, bur radio buttons work better with the script making the measurements.
The width of the graph is hard-coded to 600 pixels, but the height is programmable with the slider control. You can choose values from 100 to 400 pixels in increments of 100. A shorter graph is useful when the variation in the measurement values is small (nearly a straight, horizontal line). I have seen where RRDtool actually repeats values on the Y axis if the graph height is large and there is a small variation in measurement values. RRDtool selects the values on the Y axis, not the programmer.
Next, we have the number of measurements and the interval between measurements. The smallest interval being one minute.
Finally, we come to the matter of file names. As of now (meaning I may alter this in the future), the directory name is hard-coded in the script. I have a directory for all temperature measurements, but make up a new sub-directory, under that, based on the date (for example: 2013_10_25 for Oct. 25, 2013). The file name asked for by the widget is a base name without extension. Depending on the number of sensors used, and the number of graphs generated, we will make three to five files for each run of the script. The measurements used for the graph are stored in files with an .rrd extension - one file for each sensor. There is a .png file for each graph (one for black background, one for white). Finally, there is a .txt file generated to store all of the results, along with the measurement times, in an easily read form (the .rrd files are not easily read). This .txt file is another feature that is new with this version. If, for example, the base file name is rodger and we were to use both sensors, and generate both graphs, we would generate the following five files: rodger.txt, rodger_bread.rrd, rodger_cable.rrd, rodger_black.prn, and rodger_white.prn.
The check box to the left of the file name is to protect the files from being overwritten if they already exist. It looks in the directory with the current date. Putting a check mark in the box allows the files to be overwritten.
Let's put some values into the entry boxes but we'll make errors in all of the boxes:
After pressing the "Continue" button, the red error messages show up to the right of the entry boxes. The legend and comment boxes have non-escaped colons and the title has a non-escaped space. The measurement interval can not be zero (the number of measurements will give the same error if they total to zero). The error message will appear if a non-numeric character appears in the number of measurements or any of the measurement interval boxes.
There are three possible error messages that can appear to the right of "Base Filename". They are:
  • Only numbers, letters, and underscore
  • Will overwrite existing file ("Allow File Overwrite" not checked
  • Must enter a file name (if you leave the box empty)
Once all of the corrections have been made, hitting the "Continue" button will kill the window and allow the program that makes and graph temperature measurements to proceed. If you hit the "Quit" button the window closes and the calling script terminates.
One other action happens before the window closes. All of the parameters entered in the window widgets are saved into a configuration file. The next time the program is run, all of the parameters are loaded into the window rather than the default values. This should save a lot of time if the same run is repeated or only a few changes are made. If a lot of changes are to be made a press of the "Default" button will bring up all of the default values.
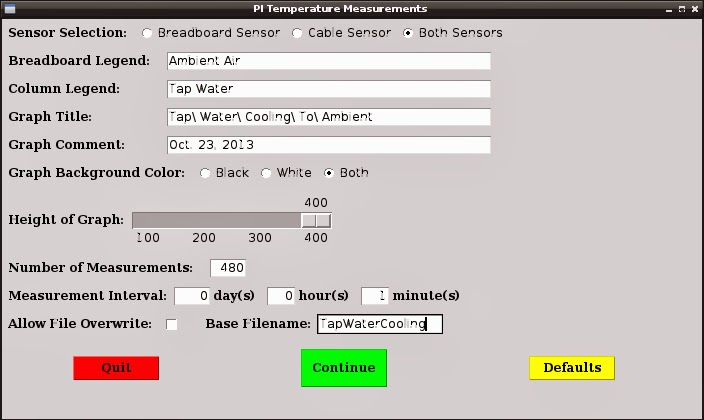
Let's do an actual run. The cable sensor is placed into a 12oz. glass of hot tap water and allowed to cool to ambient temperature. Here is the window:
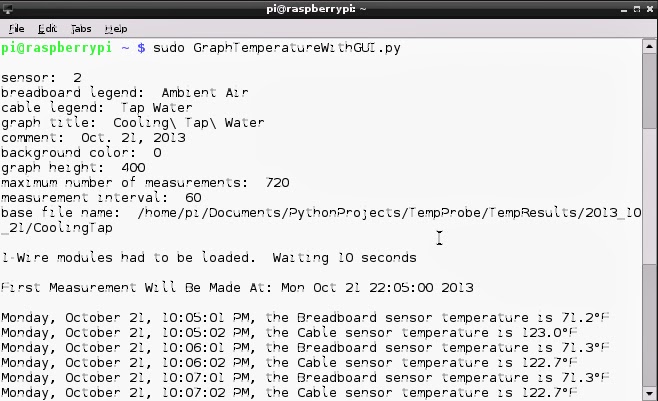
After pressing the "Continue" button the window closes and you see the terminal window:
The terminal window shows the parameters chosen on the GUI. It gives you a last look at your selections. If you decide you wanted something else, simply hit Ctrl C to terminate the script. A careful reader will notice the parameters on the terminal screen do not match the parameters chosen in the window above. That is because I forgot to save the screen shot, so two different runs are represented.
Below the parameters it says that the 1-wire modules had to be loaded. They are not loaded upon boot-up, so every time the Pi is powered up, or rebooted, the 1-wire modules must be loaded. The script checks to see if the modules are loaded, and, if not, loads them. Subsequent runs of the script will not need to load the modules if power stays applied and the Pi is not rebooted. Next, the script displays when the first measurements will be made. Recall that measurements are synchronized with the measurement interval. Since one minute was selected, we wait for the seconds to be 00. Next, we see the display of several measurements showing the day of the week, date and time, sensor, and the temperature as measured. The measurement results, along with time and sensor, are also displayed on my 16 character by two line Led Display.
After all of the measurements have been made, as stipulated by the value in "Number Of Measurements", the script will stop. If you wish to stop the script prematurely, you can simply issue a Ctrl C or press the switch on the breadboard.
Once the script is terminated, the terminal display looks similar to the figure above. This information is from yet another run. I did not coordinate that aspect of this post very well. You see the last of the measurements followed by a salutation and the reporting of the fact that there were no glitches.
Originally, I had problems with measurement failures where the device file could not be read. I call that a glitch and keep track of the number of glitches for the entire run. My solution to recover from these glitches is to unload and reload the 1-wire modules. For every glitch, I only unload and reload the modules a maximum of three times. If there is no recovery after the tree tries, I stop the script and report a message. This problem has not reoccurred, I have not seen any glitches for a long time.
The start time and stop time, are followed by long numbers. These numbers are the number of seconds since January 1, 1970. This is how RDTool records numbers in the .rrd files. If you want the time on the graph to be correct, you must apply these long numbers to the measurements. I report those numbers at the end here in case you wish to investigate the .rrd files. The information in the .rrd files look like gibberish if viewed with a text editor. You have to issue a RRDtool command to see the contents of these files. For more information see my post "RRDtool For Dummies Like Me" under the topic "What Measurement Values Go Into the Database".
Let's look at the code. The code is divided into two scripts, one for the GUI and the other for the main program that makes, graphs, and records the temperature measurements. The reason for a separate script for the GUI was to minimize changes to the main script. The main script is derived from the code shown in my blog entry, "Graphing Real Temperature Data Using RRDtool and PyRRD". The code for the GUI was developed independently, and has test code at the bottom so it can be run by itself, to check its operation. The GUI script was made a callable module by saving it as a .pyc file. The first 425 lines of the GUI code becomes a single function, guiwindow(). All of the parameters collected in the window are passed to the main script by line 103 of the main script:
     variable_list = guiwindow()

Code For the GUI Window:

I know it's a rather long script (another reason for making it separate from the main script), but a lot goes on here. Each element of the window (widgets) must be defined. Some of the widgets, when clicked on by the user, spurn actions. These actions must be defined. A lot of code is devoted to making the appearance correct. Placement of widgets is somewhat of a challenge. As in most GUI applications, user inputs are checked to make sure required parameters are not missed, or errors made. The operator is made aware of these errors by messages so he knows what to correct. The error checking requires a lot of code. Just look at the function proceed(). Most of the widgets have error messages included in their definations.
The development of the GUI is done using a module called Tkinter. It is probably available for all, common, Linux distributions for the Pi. I have developed all of my code using Python 2.7 so my line to import Tkinter is: "from Tkinter import *". In Python 3.x, that line would be "from tkinter import *". Tkinter is not just for Python, and not just for Linux.
So, how does one get started developing GUIs for their Raspberry Pi projects? There are many references, including "The Python Library Reference". This document points you to other sources, including the Python Wiki, a source with even more sources. One source you need to have available, constantly, is "Tkinter 8.5 Reference: a GUI for Python" from the Computer Center of New Mexico Tech. You need this for no other reason then getting the syntax correct. It is really a great asset to GUI development. Another good source of help is my code above, and code of others, for you to see practical examples. There are even YouTube videos with Tkinter tutorials. There is a ton of stuff out there on the net on Tkinter.
There are a few other items of interest in this script. Note the use of the Subprocess module in the function "getdirectory()". This is a way of issuing the Linux Ls command from Python. Here, Ls is used to see if a directory has been previously made. If it does not exist, the function makes the directory. Another cool thing is what happens, after the user presses "Continue" and the inputs have been found to contain no errors. Before the window closes and operation passed to the main program, all of the user's input gets saved to a file. When the window is opened again, the information in this file populates the widgets. This is done using a module called Pickle (actually cPickle. A version developed using C that runs faster than Pickle). Check it out, Pickle is a very efficient way to do the job and saves you from writing many lines of code.

Main Script For Making, Graphing, and Recording Temperature Measurements:

Since this code for the main script was discussed in my earlier post, I'm not going to say much about it. One element I added is saving the results to a text file. I discussed this earlier in the post. Lines 281 - 288, 312 - 319, and 327 - 334 handle this task. The directory and file name come from the GUI window.
I almost forgot, here are the two graphs: